
(This article was originally published at Getting Genetics Done, and syndicated at StatsBlogs.)
The cor() function will produce a basic correlation matrix. 12 years ago Bill Venables provided a function on the R help mailing list for replacing the upper triangle of the correlation matrix with the p-values for those correlations (based on the known relationship between t and r). The cor.prob() function will produce this matrix.
Finally, the flattenSquareMatrix() function will "flatten" this matrix to four columns: one column for variable i, one for variable j, one for their correlation, and another for their p-value (thanks to Chris Wallace on StackOverflow for helping out with this one).
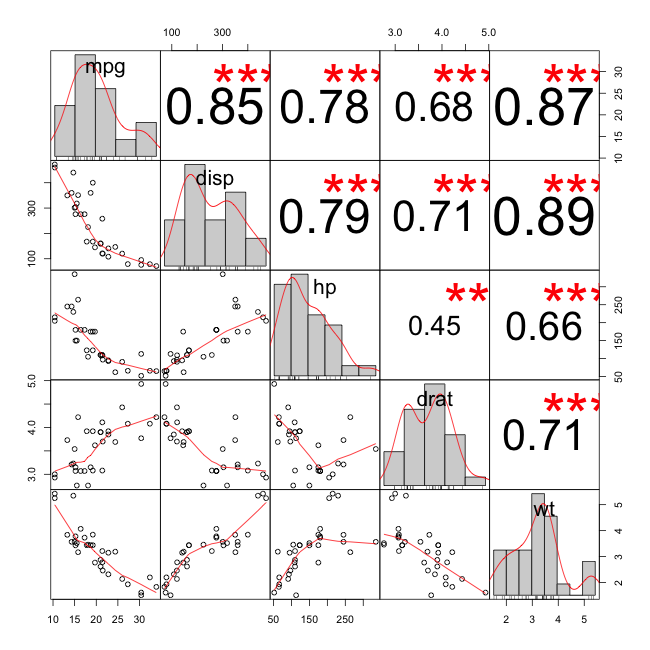
Finally, the chart.Correlation() function from the PerformanceAnalytics package produces a very nice scatterplot matrix, with histograms, kernel density overlays, absolute correlations, and significance asterisks (0.05, 0.01, 0.001):
Getting Genetics Done by Stephen Turner is licensed under a Creative Commons Attribution-ShareAlike 3.0 Unported License.
Please comment on the article here: Getting Genetics Done

