Posts Tagged ‘ plotting ’

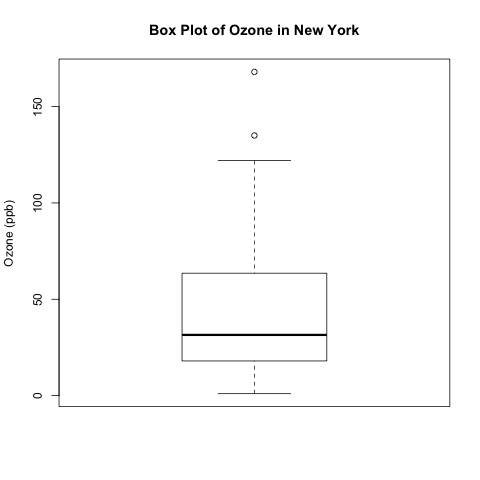
Exploratory Data Analysis: Variations of Box Plots in R for Ozone Concentrations in New York City and Ozonopolis

Exploratory Data Analysis: Variations of Box Plots in R for Ozone Concentrations in New York City and Ozonopolis

Introduction Last week, I wrote the first post in a series on exploratory data analysis (EDA).  I began by calculating summary statistics on a univariate data set of ozone concentration in New York City in the built-in data set “airquality” in R.  In particular, I talked about how to calculate those statistics when the data […]

Read more »

When Does the Kinetic Theory of Gases Fail? Examining its Postulates with Assistance from Simple Linear Regression in R

When Does the Kinetic Theory of Gases Fail?  Examining its Postulates with Assistance from Simple Linear Regression in R

Introduction The Ideal Gas Law, , is a very simple yet useful relationship that describes the behaviours of many gases pretty well in many situations.  It is “Ideal” because it makes some assumptions about gas particles that make the math and the physics easy to work with; in fact, the simplicity that arises from these […]

Read more »

Using the Golden Section Search Method to Minimize the Sum of Absolute Deviations

April 29, 2013
By
Using the Golden Section Search Method to Minimize the Sum of Absolute Deviations

Introduction Recently, I introduced the golden search method – a special way to save computation time by modifying the bisection method with the golden ratio, and I illustrated how to minimize a cusped function with this script.  I also wrote an R function to implement this method and an R script on how to apply this […]

Read more »

Checking the Goodness of Fit of the Poisson Distribution in R for Alpha Decay by Americium-241

April 15, 2013
By
Checking the Goodness of Fit of the Poisson Distribution in R for Alpha Decay by Americium-241

Introduction Today, I will discuss the alpha decay of americium-241 and use R to model the number of emissions from a real data set with the Poisson distribution.  I was especially intrigued in learning about the use of Am-241 in smoke detectors, and I will elaborate on this clever application.  I will then use the Pearson chi-squared […]

Read more »

How do Dew and Fog Form? Nature at Work with Temperature, Vapour Pressure, and Partial Pressure

April 1, 2013
By
How do Dew and Fog Form?  Nature at Work with Temperature, Vapour Pressure, and Partial Pressure

In the early morning, especially here in Canada, I often see dew – water droplets formed by the condensation of water vapour on outside surfaces, like windows, car roofs, and leaves of trees.  I also sometimes see fog – water droplets or ice crystals that are suspended in air and often blocking visibility at great […]

Read more »

Estimating the Decay Rate and the Half-Life of DDT in Trout – Applying Simple Linear Regression with Logarithmic Transformation

March 24, 2013
By
Estimating the Decay Rate and the Half-Life of DDT in Trout – Applying Simple Linear Regression with Logarithmic Transformation

This blog post uses a function and a script written in R that were displayed in an earlier blog post. Introduction This is the second of a series of blog posts about simple linear regression; the first was written recently on some conceptual nuances and subtleties about this model.  In this blog post, I will use […]

Read more »

Discovering Argon with the 2-Sample t-Test

March 11, 2013
By
Discovering Argon with the 2-Sample t-Test

I learned about Lord Rayleigh’s discovery of argon in my 2nd-year analytical chemistry class while reading “Quantitative Chemical Analysis” by Daniel Harris.  (William Ramsay was also responsible for this discovery.)  This is one of my favourite stories in chemistry; it illustrates how diligence in measurement can lead to an elegant and surprising discovery.  I find […]

Read more »

Adding Labels to Points in a Scatter Plot in R

March 2, 2013
By
Adding Labels to Points in a Scatter Plot in R

What’s the Scatter? A scatter plot displays the values of 2 variables for a set of data, and it is a very useful way to visualize data during exploratory data analysis, especially (though not exclusively) when you are interested in the relationship between a predictor variable and a target variable.  Sometimes, such data come with categorical […]

Read more »

Displaying Isotopic Abundance Percentages with Bar Charts and Pie Charts

February 17, 2013
By
Displaying Isotopic Abundance Percentages with Bar Charts and Pie Charts

The Structure of an Atom An atom consists of a nucleus at the centre and electrons moving around it.  The nucleus contains a mixture of protons and neutrons.  For most purposes in chemistry, the two most important properties about these 3 types of particles are their masses and charges.  In terms of charge, protons are […]

Read more »

How do I re-arrange…?: Ordering a plot.

October 15, 2012
By
How do I re-arrange…?: Ordering a plot.

One of the most widely seen FAQ coming across list serves and R help sites is the question: “How do I re-arrange/re-order (plotting geom/aesthetic such as bar/labels) in a (insert plot type here) using(insert graphics system here) in R?” . … Continue reading →

Read more »

Subscribe

Email:

  Subscribe