
(This article was originally published at The DO Loop, and syndicated at StatsBlogs.)
One of the advantages of the new mixed-type tables in SAS/IML 14.2 (released with SAS 9.4m4) is the greatly enhanced printing functionality. You can control which rows and columns are printed, specify formats for individual columns, and even use templates to completely customize how tables are printed. Printing a table is accomplished by using the TableCreateFromDataSet function. Finally, the TablePrint subroutine prints a customize portion of the table:
data class; set sashelp.class; Birthday = '03APR2017'd - age*365 - floor(365*uniform(1)); /* create birthday */ format Birthday DATE9.; run; proc iml; tClass = TableCreateFromDataSet("Class"); /* read data into table */ run TablePrint(tClass) firstobs=3 numobs=5 var={"Age" "Birthday"} ID="Name" label="Subset of Class"; |
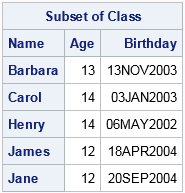
Notice that the table contains both numeric and character columns. Furthermore, the numeric columns have different formats. The TablePrint subroutine has some distinct advantages over the traditional PRINT statement in SAS/IML:
- The TablePrint subroutine supports an easy way to display a range of observations. When you use the PRINT statement for multiple vectors, you have to use row subscripts in each vector, such as PRINT (X[3:8,]) (Y[3:8,]);
- The TablePrint subroutine supports printing any columns in any order. When you use the PRINT statement on a matrix, you have to use column subscripts to change the order of the matrix columns: PRINT (X[, {2 3 1}]);
- The PRINT statement supports the ROWNAME= option (for specifying row headers), the COLNAME= option (for specifying column headers), and the LABEL= option. Those options are easy to work with when you print a single matrix. However, you can't store mixed-type data in a matrix and those options are less convenient when you print a set of vectors.
Advanced printing of SAS/IML tables
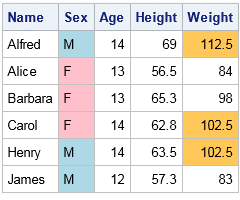
The SAS/IML documentation
has several sections of documentation devoted to
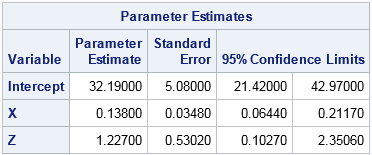
For statistical programmers, the ability to use ODS templates means that output from PROC IML can look the same as output from some other SAS procedue. For example, suppose that you have a table that contains parameter estimates for a linear regression. The following example prints that table by using the same ODS template that PROC REG uses, which is the Stat.Reg.ParameterEstimates template:
This example works because the column names in the SAS/IML table match the names that are expected by the Stat.REG.ParameterEstimates template. The DYNAMIC= option specifies a dynamic variable (Confidence) that the template requires. See the documentation for further details.
In summary, the TablePrint subroutine in SAS/IML gives programmers control over many options for printing tables of data and statistics. For complex layouts, you can use an existing ODS template or create your own template to customize virtually every aspect of your tabular displays.
For more information about SAS/IML tables, see the SAS Global Forum paper "More Than Matrices" (Wicklin, 2017).
The post Print tables in SAS/IML appeared first on The DO Loop.proc iml;
vars = {"Intercept", X, Z};
stats = {32.19 5.08 21.42 42.97,
0.138 0.0348 0.0644 0.2117,
1.227 0.5302 0.1027 2.3506 };
tbl = TableCreate("Variable", vars);
call TableAddVar(tbl, {"Estimate" "StdErr" "LowerCL" "UpperCL"}, stats);
Confidence=95;
call TablePrint(tbl) template="Stat.Reg.ParameterEstimates"
dynamic={Confidence};
Summary
Please comment on the article here: The DO Loop
