
(This article was originally published at EconBS, and syndicated at StatsBlogs.)
There are many ways so predict the future. All of them have a fair degree of uncertainty. Nate Silver at FiveThityEight uses a measure of ethnicity and political leanings to predict how well Sanders will do in different states. This seems like a sound method to me though it is not the only way to make predictions.
For the last month I have been playing with campaign contributions data and have seen a strong and steady increase in support for Bernie Sanders across the nation. I have mapped it county by county and the results are quite dramatic.
Yet, what does grassroots support really mean? Does it translate to votes?
In February, with only four states having voted, it was impossible to say how contributions translated to votes. But Super-Tuesday changed all of that!
With fifteen states having voted, we can now see if financial support maps to voting support.
From Figure 1, we can see there appears to be a pretty strong relationship between percent of vote actually cast and percent of support coming in for that candidate. Let's try a formal model:
$$Vote = \beta_0 + \beta_1 ContSanders + \beta_2 Primary + \beta_3 Closed $$ Vote is the actual vote in the state. The explanatory variables are percent contributing to Sanders (ContSander). Primary and Closed refer to the difference between primary vs caucus voting systems and closed vs open. For closed systems only registered democrats are allowed to vote.
Looking at Table 1, with 79% of the variance explained (r2), we can see that percent of support coming in for a candidate from a state at the end of February is a very good predictor of how the vote will go. Increasing the number of explanatory variables increases the r2 to 86%.
Table 1: The regression of Vote on ContSanders is V1 while V2 and V3 allow the inclusion of the explanatory variables Primary and Closed.
* Coefficient significant at 10%, ** at 1%, and *** at 0.1%
When examining the coefficient on ContSanders it is useful to reflect that while this value is statistically very different from zero, the point value estimate is reasonably close to 1. This is the target number we would like if we were to directly interpret proportion of supporters in a states as a good indicator of proportion of population in state supporting Sanders. This interpretation does not make sense since most of the contributions to Sanders campaign (72% of them) are not itemized (and thus included in this analysis) because they are less than the FEC threshold of $200 while a much smaller number (about 12%) of those for the Clinton campaign are not itemized.
A priori I did not have any hypothesis as to how the Primary vs Caucus method was going to play out though I did expect those states with Closed voting to be less likely to vote for Sanders as he is strongly favored among independents.
From these numbers coefficients we can now make predictions about how the rest of the states would vote if all of the states voted today (well really March 1st, Super Tuesday). The results give a point estimate of 42% of primary locations going to Sanders with a total expected number of pledged delegates of 1740 to that of Clinton 2285. So Clinton is expected to win??
But wait! Not quite so fast!
The election will not be held tomorrow. The momentum has been strongly with Sanders and it should be expected to stay strongly with Sanders.
From the Figure 2 through 5, we can see that the growth in support for Sanders has been steadily increasing in all areas of the country. The regions most friendly to Clinton are the South and the Northeast while those most friendly to Sanders are the West and the Midwest.
The South happens to be the region least supportive of Sanders campaign though it has had more votes than all other states combined. Thus we may be getting a distorted picture of how the primary season may go based on how these first few states have voted.
If we fit a simple line to each state then assume that growth in support will continue at a steady pace until the primary at that state.
Predicting support based on historic rate of donations predicts that almost all states will have greater support for Sanders than they did at the end of January. States which have experienced more growth in support for Sanders or has later primaries tend to end up further to the right on the graph. The diagonal line is what happens if there was no growth in support for Sanders over time.
Using these new expected support levels at the time of the primaries that have already happened we can fit a new model.
Table 2: This tables shows the results of using expected proportion of Sanders supporters as predictors for election results rather than actual support as of the end of January.
From Table 2, we can see that using predicted Sanders support rather than that last observed at the end of January gives us a slightly higher r2. However, those of us familiar with estimation will immediately realize that we have introduced a new level of uncertainty into the data. This is because we are using an estimated value to estimate yet another value.
Ignoring estimation uncertainty, using the best fit model I predict Sanders will get 57% of the pledged delegates. However, point estimates in statistics are almost never true. In order to estimate the error in the process I simulate randomly sampling from the distribution of possible coefficients for the Intercept, ContSanderP, Primary, and Closed coefficients and predict delegate distribution. 72% of the time Sanders is expected to get the majority of pledged delegates.
Yet, I have ignored the error in estimating the support for Sanders. Rather than doing something more complicated instead what I do is increase the standard error on all coefficients by a factor of 150% and simulate the delegate distribution again. Under this situation I predict Sanders will take the majority of the pledged delegates 64% of the time. (Note the more you increase the standard error the more watered down the predictions become until all you have is a 50-50 chance of Sanders winning.)
Conclusion
It will come as no surprise to anybody that I am an avid Bernie Sanders supporter. The level of corruption and deceit that seem endemic to the Clinton campaign combined with the consistent upright behavior and spot of messages of the Sanders campaign makes my endorsement of Sanders very easy. I might have considered supporting one of the Republican candidates, however Trump seems to be cleaning house.
It might come as some surprise that a self-described economist would openly support Sanders. However, the exaggerated claims that "economists" are opposed to Sanders does not add up when you look at the actual fiscal support Sanders has received from economists. As of the end of January, Sanders has logged 155 contributions from economists compared with Clinton's 189. That is to say 45% of contributions made to either campaign from economists have gone to the Sanders campaign.
So it was frustrating for me to see that Sanders seemed to be already getting behind in the pledged delegates for these first primary states. However, a few nights ago I built the models and crunched the numbers and was much relieved to find that not only was Sanders predicted to do well, but win the popular vote, and the majority of pledged delegates!
I know there is much uncertainty in any kind of predictions, especially one as surprising as this election season. Thus, I caution reading to much into this prediction or really any predictions that are coming out. Frankly, this model using contribution data seems to fit the data remarkably well and the results are encouraging. But even if the model predicted Clinton would take the pledged delegates and the popular vote, I would also strongly caution reading too much into such predictions.
Only 15 states have voted representing only 25% of the pledged delegates. All the while those who learn about Sanders seem to like him more and more while for Clinton the phenomenon seems to be going the other way.
As for my code. I am happy to release it however it is not in a good condition right now. I will have to revise it for public posting. That might take a few days but I wanted to get this out right now.
End Note:
I could imagine someone saying, "What do pledged delegates matter anyways since so many delegates are determined by unpledged or super-delegates?"
I can tell you this for certain if Clinton does not win by taking the majority of pledged delegates but rather though internal party politics then it is highly unlikely the majority of Sanders supporters are going to support her in the general election. Already, many of us are put off by the games the DNC have been playing by first restricting the debate schedule so as to minimize air time of democratic challengers to Clinton then by trying to cut Sanders off from access to the voter database.
This behavior coupled with ongoing ethical and potential legal violations by the Clinton campaign have given Sanders supporters a very strong dislike for underhanded tricks. Using party insiders to win the nomination against the will of the electorate, would be seen as intolerable.
Appendix:
Just for fun I have included the following list of predicted outcomes and actual outcomes as well as the predicted number of pledged delegates if all pledged delegates where distributed proportionately to that of the vote. Notice that the predicted outcomes for any given state can vary quite significantly. However, it is only across states that we hope to come up with a cumulative expected outcome that may be reasonable.
For the last month I have been playing with campaign contributions data and have seen a strong and steady increase in support for Bernie Sanders across the nation. I have mapped it county by county and the results are quite dramatic.
Yet, what does grassroots support really mean? Does it translate to votes?
In February, with only four states having voted, it was impossible to say how contributions translated to votes. But Super-Tuesday changed all of that!
With fifteen states having voted, we can now see if financial support maps to voting support.
 |
| Figure 1: This figure shows a relationship between percent of support for all times reported as of January 31st coming from that state with percent of vote (delegates when not available) coming from that state at the primary. |
$$Vote = \beta_0 + \beta_1 ContSanders + \beta_2 Primary + \beta_3 Closed $$ Vote is the actual vote in the state. The explanatory variables are percent contributing to Sanders (ContSander). Primary and Closed refer to the difference between primary vs caucus voting systems and closed vs open. For closed systems only registered democrats are allowed to vote.
Looking at Table 1, with 79% of the variance explained (r2), we can see that percent of support coming in for a candidate from a state at the end of February is a very good predictor of how the vote will go. Increasing the number of explanatory variables increases the r2 to 86%.
Table 1: The regression of Vote on ContSanders is V1 while V2 and V3 allow the inclusion of the explanatory variables Primary and Closed.
| V1 | V2 | V3 | |
|---|---|---|---|
| (Intercept) | -24.317* | -16.122 | -11.988 |
| (Intercept)_se | {10.175} | {10.551} | {10.352} |
| ContSanders | 1.155*** | 1.118*** | 1.134*** |
| ContSanders_se | {0.165} | {0.155} | {0.147} |
| Primary | -8.118 | -10.711* | |
| Primary_se | {4.642} | {4.710} | |
| Closed | -6.883 | ||
| Closed_se | {4.474} | ||
| r2 | 0.790 | 0.833 | 0.862 |
| r2adj | 0.774 | 0.805 | 0.825 |
| fstat | 48.9 | 29.9 | 23 |
| pstat | 0 | 0 | 0 |
| sig | p < 0.001% | p < 0.01% | p < 0.01% |
When examining the coefficient on ContSanders it is useful to reflect that while this value is statistically very different from zero, the point value estimate is reasonably close to 1. This is the target number we would like if we were to directly interpret proportion of supporters in a states as a good indicator of proportion of population in state supporting Sanders. This interpretation does not make sense since most of the contributions to Sanders campaign (72% of them) are not itemized (and thus included in this analysis) because they are less than the FEC threshold of $200 while a much smaller number (about 12%) of those for the Clinton campaign are not itemized.
A priori I did not have any hypothesis as to how the Primary vs Caucus method was going to play out though I did expect those states with Closed voting to be less likely to vote for Sanders as he is strongly favored among independents.
From these numbers coefficients we can now make predictions about how the rest of the states would vote if all of the states voted today (well really March 1st, Super Tuesday). The results give a point estimate of 42% of primary locations going to Sanders with a total expected number of pledged delegates of 1740 to that of Clinton 2285. So Clinton is expected to win??
But wait! Not quite so fast!
The election will not be held tomorrow. The momentum has been strongly with Sanders and it should be expected to stay strongly with Sanders.
 |
| Figure 2: Percent of contributions going to Sanders relative to that of Clinton in the South. Interestingly DC is the largest proportional supporter of Hillary. That is because it is the state/district which best exemplifies Hillary's primary backers, wealthy. States with black outlines have yet to vote. |
 |
| Figure 3: Percent of contributions going to Sanders relative to that of Clinton in the Northeast. States with black outlines have yet to vote. |
 |
| Figure 4: Percent of contributions going to Sanders relative to that of Clinton in the Midwest. States with black outlines have yet to vote. |
 |
| Figure 5: Percent of contributions going to Sanders relative to that of Clinton in the West. States with black outlines have yet to vote. |
From the Figure 2 through 5, we can see that the growth in support for Sanders has been steadily increasing in all areas of the country. The regions most friendly to Clinton are the South and the Northeast while those most friendly to Sanders are the West and the Midwest.
The South happens to be the region least supportive of Sanders campaign though it has had more votes than all other states combined. Thus we may be getting a distorted picture of how the primary season may go based on how these first few states have voted.
If we fit a simple line to each state then assume that growth in support will continue at a steady pace until the primary at that state.
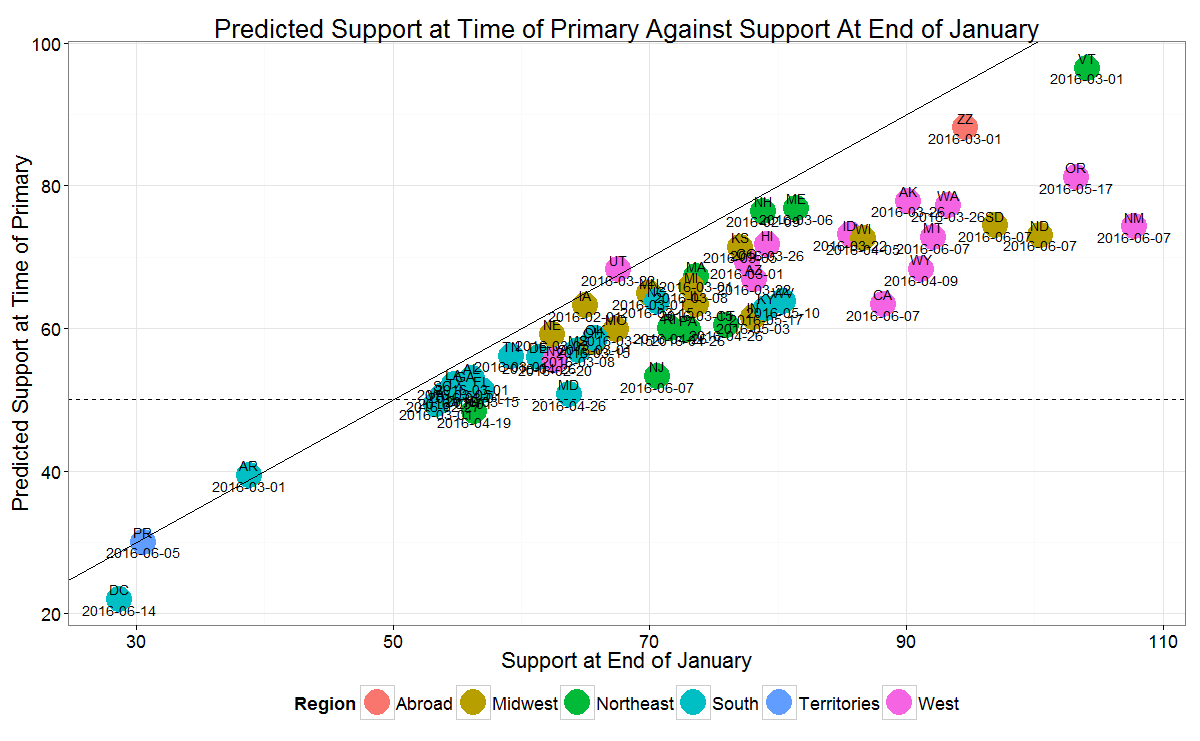 |
| Figure 6: Predicted support at time of primary mapped against support at end of January. ZZ are democrats abroad. |
Using these new expected support levels at the time of the primaries that have already happened we can fit a new model.
Table 2: This tables shows the results of using expected proportion of Sanders supporters as predictors for election results rather than actual support as of the end of January.
| V1 | V2 | V3 | |
|---|---|---|---|
| (Intercept) | -22.886* | -15.49 | -11.352 |
| (Intercept)_se | {9.539} | {10.37} | {10.178} |
| ContSandersP | 1.053*** | 1.02*** | 1.032*** |
| ContSandersP_se | {0.144} | {0.14} | {0.133} |
| Primary | -6.92 | -9.484* | |
| Primary_se | {4.63} | {4.688} | |
| Closed | -6.864 | ||
| cCosed_se | {4.435} | ||
| r2 | 0.805 | 0.835 | 0.865 |
| r2adj | 0.79 | 0.808 | 0.828 |
| fstat | 53.6 | 30.4 | 23.4 |
| pstat | 0 | 0 | 0 |
| sig | p < 0.001% | p < 0.01% | p < 0.01% |
From Table 2, we can see that using predicted Sanders support rather than that last observed at the end of January gives us a slightly higher r2. However, those of us familiar with estimation will immediately realize that we have introduced a new level of uncertainty into the data. This is because we are using an estimated value to estimate yet another value.
Ignoring estimation uncertainty, using the best fit model I predict Sanders will get 57% of the pledged delegates. However, point estimates in statistics are almost never true. In order to estimate the error in the process I simulate randomly sampling from the distribution of possible coefficients for the Intercept, ContSanderP, Primary, and Closed coefficients and predict delegate distribution. 72% of the time Sanders is expected to get the majority of pledged delegates.
Yet, I have ignored the error in estimating the support for Sanders. Rather than doing something more complicated instead what I do is increase the standard error on all coefficients by a factor of 150% and simulate the delegate distribution again. Under this situation I predict Sanders will take the majority of the pledged delegates 64% of the time. (Note the more you increase the standard error the more watered down the predictions become until all you have is a 50-50 chance of Sanders winning.)
Conclusion
It will come as no surprise to anybody that I am an avid Bernie Sanders supporter. The level of corruption and deceit that seem endemic to the Clinton campaign combined with the consistent upright behavior and spot of messages of the Sanders campaign makes my endorsement of Sanders very easy. I might have considered supporting one of the Republican candidates, however Trump seems to be cleaning house.
It might come as some surprise that a self-described economist would openly support Sanders. However, the exaggerated claims that "economists" are opposed to Sanders does not add up when you look at the actual fiscal support Sanders has received from economists. As of the end of January, Sanders has logged 155 contributions from economists compared with Clinton's 189. That is to say 45% of contributions made to either campaign from economists have gone to the Sanders campaign.
So it was frustrating for me to see that Sanders seemed to be already getting behind in the pledged delegates for these first primary states. However, a few nights ago I built the models and crunched the numbers and was much relieved to find that not only was Sanders predicted to do well, but win the popular vote, and the majority of pledged delegates!
I know there is much uncertainty in any kind of predictions, especially one as surprising as this election season. Thus, I caution reading to much into this prediction or really any predictions that are coming out. Frankly, this model using contribution data seems to fit the data remarkably well and the results are encouraging. But even if the model predicted Clinton would take the pledged delegates and the popular vote, I would also strongly caution reading too much into such predictions.
Only 15 states have voted representing only 25% of the pledged delegates. All the while those who learn about Sanders seem to like him more and more while for Clinton the phenomenon seems to be going the other way.
As for my code. I am happy to release it however it is not in a good condition right now. I will have to revise it for public posting. That might take a few days but I wanted to get this out right now.
End Note:
I could imagine someone saying, "What do pledged delegates matter anyways since so many delegates are determined by unpledged or super-delegates?"
I can tell you this for certain if Clinton does not win by taking the majority of pledged delegates but rather though internal party politics then it is highly unlikely the majority of Sanders supporters are going to support her in the general election. Already, many of us are put off by the games the DNC have been playing by first restricting the debate schedule so as to minimize air time of democratic challengers to Clinton then by trying to cut Sanders off from access to the voter database.
This behavior coupled with ongoing ethical and potential legal violations by the Clinton campaign have given Sanders supporters a very strong dislike for underhanded tricks. Using party insiders to win the nomination against the will of the electorate, would be seen as intolerable.
Appendix:
Just for fun I have included the following list of predicted outcomes and actual outcomes as well as the predicted number of pledged delegates if all pledged delegates where distributed proportionately to that of the vote. Notice that the predicted outcomes for any given state can vary quite significantly. However, it is only across states that we hope to come up with a cumulative expected outcome that may be reasonable.
| State | Primary Date | Prediction | TRUE | Pledged Sanders | Pledged Clinton | N | |
|---|---|---|---|---|---|---|---|
| 1 | IA | 2/1/2016 | 46 | 50 | 22 | 24 | 3950 |
| 2 | NH | 2/9/2016 | 62 | 61 | 15 | 9 | 5030 |
| 3 | NV | 2/20/2016 | 44 | 47 | 17 | 20 | 4105 |
| 4 | SC | 2/27/2016 | 45 | 26 | 14 | 29 | 3757 |
| 5 | AL | 3/1/2016 | 38 | 20 | 10 | 33 | 2547 |
| 6 | AR | 3/1/2016 | 30 | 31 | 10 | 22 | 3473 |
| 7 | CO | 3/1/2016 | 59 | 59 | 39 | 27 | 13735 |
| 8 | GA | 3/1/2016 | 38 | 28 | 29 | 64 | 8820 |
| 9 | MA | 3/1/2016 | 61 | 49 | 45 | 36 | 25573 |
| 10 | MN | 3/1/2016 | 61 | 62 | 47 | 30 | 9623 |
| 11 | OK | 3/1/2016 | 53 | 56 | 21 | 18 | 3111 |
| 12 | TN | 3/1/2016 | 51 | 33 | 22 | 33 | 5575 |
| 13 | TX | 3/1/2016 | 46 | 34 | 75 | 119 | 27077 |
| 14 | VA | 3/1/2016 | 45 | 35 | 34 | 52 | 15702 |
| 15 | VT | 3/1/2016 | 97 | 86 | 14 | 0 | 12563 |
| 16 | ZZ | 3/1/2016 | 86 | NA | 11 | 2 | 920 |
| 17 | KS | 3/5/2016 | 59 | NA | 19 | 14 | 2997 |
| 18 | LA | 3/5/2016 | 37 | NA | 19 | 32 | 2853 |
| 19 | NE | 3/5/2016 | 44 | NA | 11 | 14 | 1724 |
| 20 | ME | 3/6/2016 | 63 | NA | 16 | 9 | 3829 |
| 21 | MI | 3/8/2016 | 65 | NA | 85 | 45 | 11472 |
| 22 | MS | 3/8/2016 | 56 | NA | 20 | 16 | 854 |
| 23 | FL | 3/15/2016 | 39 | NA | 83 | 131 | 28191 |
| 24 | IL | 3/15/2016 | 66 | NA | 102 | 54 | 21651 |
| 25 | MO | 3/15/2016 | 59 | NA | 42 | 29 | 6384 |
| 26 | NC | 3/15/2016 | 58 | NA | 62 | 45 | 11057 |
| 27 | OH | 3/15/2016 | 57 | NA | 82 | 61 | 10091 |
| 28 | AZ | 3/22/2016 | 70 | NA | 53 | 22 | 10288 |
| 29 | ID | 3/22/2016 | 77 | NA | 18 | 5 | 1677 |
| 30 | UT | 3/22/2016 | 58 | NA | 19 | 14 | 2859 |
| 31 | AK | 3/26/2016 | 72 | NA | 12 | 4 | 1891 |
| 32 | HI | 3/26/2016 | 61 | NA | 15 | 10 | 2823 |
| 33 | WA | 3/26/2016 | 85 | NA | 86 | 15 | 28682 |
| 34 | WI | 4/5/2016 | 70 | NA | 60 | 26 | 7374 |
| 35 | WY | 4/9/2016 | 73 | NA | 10 | 4 | 696 |
| 36 | NY | 4/19/2016 | 38 | NA | 95 | 152 | 55636 |
| 37 | CT | 4/26/2016 | 59 | NA | 32 | 23 | 9237 |
| 38 | DE | 4/26/2016 | 44 | NA | 9 | 12 | 1119 |
| 39 | MD | 4/26/2016 | 46 | NA | 44 | 51 | 14771 |
| 40 | PA | 4/26/2016 | 56 | NA | 105 | 84 | 16231 |
| 41 | RI | 4/26/2016 | 59 | NA | 14 | 10 | 2494 |
| 42 | IN | 5/3/2016 | 70 | NA | 58 | 25 | 5346 |
| 43 | WV | 5/10/2016 | 68 | NA | 20 | 9 | 1632 |
| 44 | KY | 5/17/2016 | 62 | NA | 34 | 21 | 2921 |
| 45 | OR | 5/17/2016 | 87 | NA | 53 | 8 | 15170 |
| 46 | PR | 6/5/2016 | 20 | NA | 12 | 48 | 566 |
| 47 | CA | 6/7/2016 | 81 | NA | 383 | 92 | 113314 |
| 48 | MT | 6/7/2016 | 85 | NA | 18 | 3 | 1658 |
| 49 | ND | 6/7/2016 | 92 | NA | 17 | 1 | 427 |
| 50 | NJ | 6/7/2016 | 53 | NA | 67 | 59 | 13513 |
| 51 | NM | 6/7/2016 | 91 | NA | 31 | 3 | 6658 |
| 52 | SD | 6/7/2016 | 85 | NA | 17 | 3 | 714 |
| 53 | DC | 6/14/2016 | 10 | NA | 2 | 18 | 9298 |
| Total: | 2249 | 1691 |
Please comment on the article here: EconBS
