Posts Tagged ‘ plot() ’

approximate lasso

October 2, 2016
By
approximate lasso

Here is a representation of the precision of a kernel density estimate (second axis) against the true value of the density (first axis), which looks like a lasso of sorts, hence the title. I am not sure this tells much, except that the estimated values are close to the true values and that a given […]

Read more »

Visualising the predictive distribution of a log-transformed linear model

August 25, 2015
By
Visualising the predictive distribution of a log-transformed linear model

Last week I presented visualisations of theoretical distributions that predict ice cream sales statistics based on linear and generalised linear models, which I introduced in an earlier post.Theoretical distributionsToday I will take a closer look at t...

Read more »

Visualising theoretical distributions of GLMs

August 18, 2015
By
Visualising theoretical distributions of GLMs

Two weeks ago I discussed various linear and generalised linear models in R using ice cream sales statistics. The data showed not surprisingly that more ice cream was sold at higher temperatures.icecream

Read more »

Using and Producing a Control Chart in R for Statistical Process Control – An Application in Analytical Chemistry

Using and Producing a Control Chart in R for Statistical Process Control – An Application in Analytical Chemistry

Update on Wednesday, August 5, 2015: I am considering retracting this blog post based on my disagreement with Daniel Harris’ approach to building the warning and action lines in a control chart.  Please see my replies to Jake Yeager and Lee Kennedy in the comments section for my thoughts.  Your patience is appreciated; please stay […]

Read more »

R brut

July 2, 2015
By
R brut

Filed under: Kids, pictures, R, Statistics, University life Tagged: cex, pch, plot, R

Read more »

Waterfall and 3D plotting exploration

October 9, 2014
By
Waterfall and 3D plotting exploration

Taking the very cool 'waterfall graph' code posted by Robert Grant I have added some features (resistance to distributions with sparse data at some areas) as well as the ability to heat map the bivariate distribution based on a third variable z. Find t...

Read more »

Generating and visualising multivariate random numbers in R

June 24, 2014
By
Generating and visualising multivariate random numbers in R

This post will present the wonderful pairs.panels function of the psych package [1] that I discovered recently to visualise multivariate random numbers.Here is a little example with a Gaussian copula and normal and log-normal marginal distributions. I ...

Read more »

Trapezoidal Integration – Conceptual Foundations and a Statistical Application in R

Trapezoidal Integration – Conceptual Foundations and a Statistical Application in R

Introduction Today, I will begin a series of posts on numerical integration, which has a wide range of applications in many fields, including statistics.  I will introduce trapezoidal integration by discussing its conceptual foundations, write my own R function to implement trapezoidal integration, and use it to check that the Beta(2, 5) probability density function […]

Read more »

Sentence Drawing: Function vs. Art

December 8, 2013
By
Sentence Drawing: Function vs. Art

I recently was reading the book “Functional Art” and came across the work of Stefanie Posavec. Her Sentence Drawings (click here to see and click here to learn) caught my attention. Here is a ggplot2 rendition: From what I understand … Continue reading →

Read more »

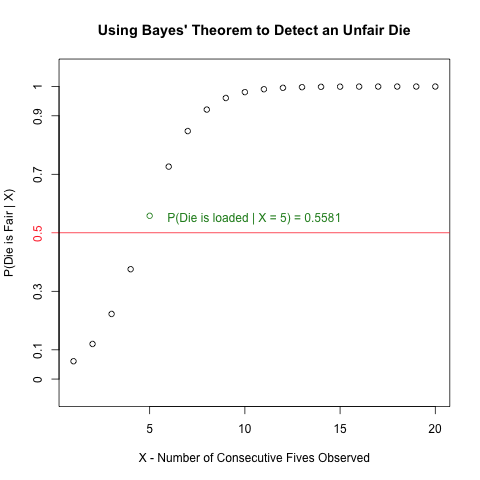
Detecting Unfair Dice in Casinos with Bayes’ Theorem

Detecting Unfair Dice in Casinos with Bayes’ Theorem

Introduction I saw an interesting problem that requires Bayes’ Theorem and some simple R programming while reading a bioinformatics textbook.  I will discuss the math behind solving this problem in detail, and I will illustrate some very useful plotting functions to generate a plot from R that visualizes the solution effectively. The Problem The following question is […]

Read more »


Subscribe

Email:

  Subscribe