Blog Archives

Discriminating Fisher’s iris data by using the petal areas

August 9, 2012
By
Discriminating Fisher’s iris data by using the petal areas

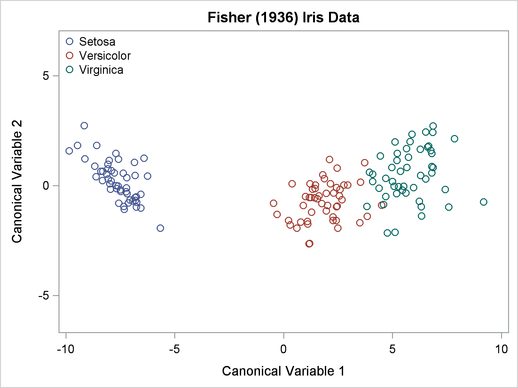
I've seen analyses of Fisher's iris data so often that sometimes I feel like I can smell the flowers' scent. However, yesterday I stumbled upon an analysis that I hadn't seen before. The typical analysis is shown in the documentation for the CANDISC procedure in the SAS/STAT documentation. A (canonical) [...]
Read more »

Change a plot title by using the ODS Graphics Editor

August 6, 2012
By
Change a plot title by using the ODS Graphics Editor

A comment to last week's article on "How to get data values out of ODS graphics" indicated that the technique would be useful for changing the title on an ODS graph "without messing around with GTL." You can certainly use the technique for that purpose, but if you want to [...]

Read more »

How to get data values out of ODS graphics

August 1, 2012
By
How to get data values out of ODS graphics

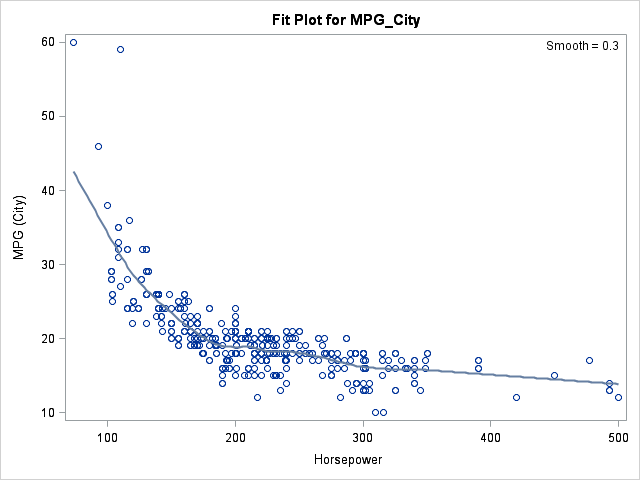
Many SAS procedures can produce ODS statistical graphics as naturally as they produce tables. Did you know that it is possible to obtain the numbers underlying an ODS statistical graph? This post shows how. Suppose that a SAS procedure creates a graph that displays a curve and that you want [...]

Read more »

The power operators: Powers of matrices and matrix elements

July 30, 2012
By
The power operators: Powers of matrices and matrix elements

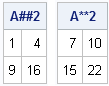
I received the following question: In the DATA step I always use the ** operator to raise a values to a power, like this: x**2. But on your blog I you use the ## operator to raise values to a power in SAS/IML programs. Does SAS/IML not support the ** [...]

Read more »

Using macro loops for simulation

July 25, 2012
By
Using macro loops for simulation

Last week I wrote an article in which I pointed out that many SAS programmers write a simulation in SAS by writing a macro loop. This approach is extremely inefficient, so I presented a more efficient technique. Not only is the macro loop approach slow, but there are other undesirable [...]

Read more »

Simulation in SAS: The slow way or the BY way

July 18, 2012
By
Simulation in SAS: The slow way or the BY way

Over the past few years, and especially since I posted my article on eight tips to make your simulation run faster, I have received many emails (often with attached SAS programs) from SAS users who ask for advice about how to speed up their simulation code. For this reason, I [...]

Read more »

Indexing a SAS data set to improve processing categories in SAS/IML

July 16, 2012
By
Indexing a SAS data set to improve processing categories in SAS/IML

I have blogged about three different SAS/IML techniques that iterate over categories and process the observations in each category. The three techniques are as follows: Use a WHERE clause on the READ statement to read only the observations in the ith category. This is described in the article "BY-group processing [...]

Read more »

Visualize the bivariate normal cumulative distribution

July 11, 2012
By
Visualize the bivariate normal cumulative distribution

When you are working with probability distributions (normal, Poisson, exponential, and so forth), there are four essential functions that a statistical programmer needs. As I've written before, for common univariate distributions, SAS provides the following functions: the PDF function, which returns the probability density at a given point the CDF [...]

Read more »

Reordering data to match a target order

July 9, 2012
By
Reordering data to match a target order

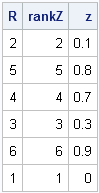
Suppose that you have two data vectors, x and y, with the same number of elements. How can you rearrange the values of y so that they have the same relative order as the values of x? In other words, find a permutation, π, of the elements of y so [...]

Read more »

Compute the multivariate normal denstity in SAS

July 5, 2012
By
Compute the multivariate normal denstity in SAS

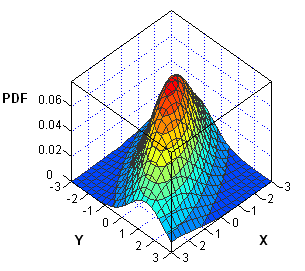
I've been working on a new book about Simulating Data with SAS. In researching the chapter on simulation of multivariate data, I've noticed that the probability density function (PDF) of multivariate distributions is often specified in a matrix form. Consequently, the multivariate density can usually be computed by using the [...]

Read more »


Subscribe

Email:

  Subscribe