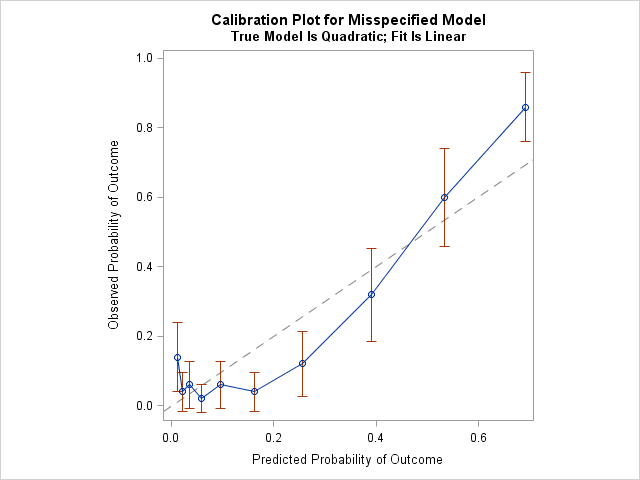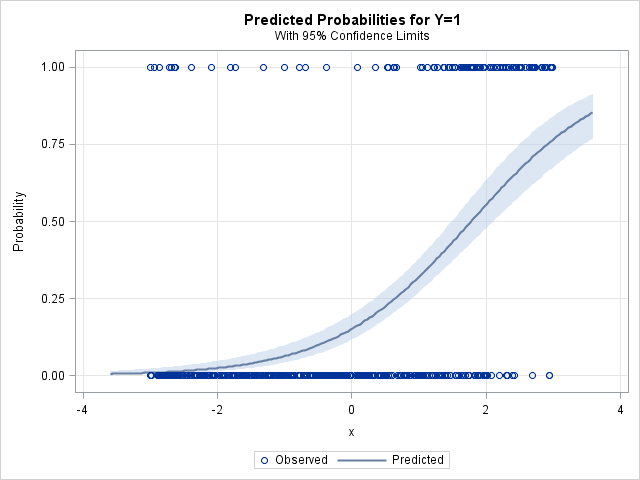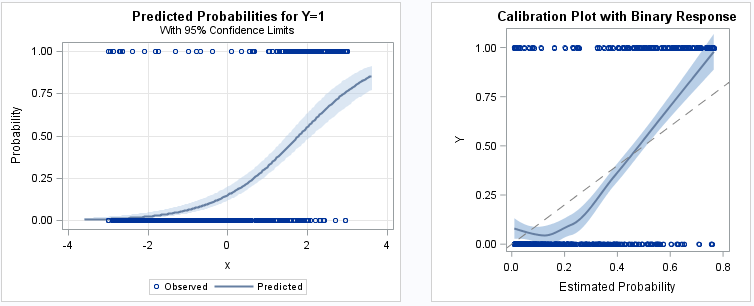
A previous article showed how to use a calibration plot to visualize the goodness-of-fit for a logistic regression model. It is common to overlay a scatter plot of the binary response on a predicted probability plot (below, left) and on a calibration plot (below, right): The SAS program that creates [...] The post Use a fringe plot to visualize binary data in logistic models appeared first on The DO Loop.