
(This article was originally published at Econometrics Beat: Dave Giles' Blog, and syndicated at StatsBlogs.)
Once upon a time there was a rule of thumb that there were 20 sheep in New Zealand for every person living there. Yep, I kid you not. The old adage used to be "3 million people; 60 million sheep".
I liked to think of this as another important "Great Ratio". You know - in the spirit of the famous "Great Ratios" suggested by Klein and Kosubod (1961) in the context of economic growth, and subsequently analysed and augmented by a variety of authors. The latter include Simon (1990), Harvey et al. (2003), Attfield and Temple (2010), and others.
After all, it's said that (at least in the post-WWII era) the economies of both Australia and New Zealand "rode on the sheep's back". If that's the case, then the New Zealand Sheep Ratio (NZSR) may hold important clues for economic growth in that country.
My interest in this matter right now comes from reading an alarming press release from Statistics New Zealand, a few days ago. The latest release of the Agricultural Production Statistics for N.Z. revealed that the (provisional) figure for the number of sheep was (only!) 26.9 million at the end of June 2014 - down 4% from 2013.
I was shocked, to say the least! Worse was to come. The 2014 figure puts the number of sheep in N.Z. at the lowest level since 1943!
I'm sure you can understand my concern. We'd better take a closer look at this, and what it all means for the NZSR:
Let's begin with the raw numbers, courtesy of Statistics N.Z.'s free and user-friendly interface, "Infoshare".

The breaks in the sheep series are due to the fact that no agricultural survey was conducted in certain years. I don't know why not.
I'm going to do some unit root testing, so these gaps have to be dealt with. In line with my work with Kevin Ryan (as discussed in an earlier post, here), I've filled in the four gaps in the series with the previous actual value.
With the human population rising, and the sheep population declining, you don't have to be a rocket scientist to know what's been happening to the NZSR:
I used the long-run historical data for the (human) population, which is why that series ends in 2011. More recent data are available, of course, but I couldn't easily match them to the historical series. This is really of no consequence for what I'm going to do here.
The breaks in the sheep series are due to the fact that no agricultural survey was conducted in certain years. I don't know why not.
I'm going to do some unit root testing, so these gaps have to be dealt with. In line with my work with Kevin Ryan (as discussed in an earlier post, here), I've filled in the four gaps in the series with the previous actual value.
With the human population rising, and the sheep population declining, you don't have to be a rocket scientist to know what's been happening to the NZSR:

Arguably, the NZSR was relatively stable up until about the end of the 1980's, but after that..........the end of an era.
The first thing that I've done is to "trick" EViews into giving me access to the standard tests that we use for structural change in a regression model. I regressed NZSR on just an intercept (and no other regressors), using OLS. The estimated intercept is just the sample mean for NZSR, and the residuals for the regresssion are just the NZSR data, expressed as deviations about this sample mean. Now I can apply tests for structural change, effectively to the mean-adjusted NZSR series. (I mentioned this trick in an earlier post.)
Specifically, here are the results of applying the test suggested by Bai and Perron (1998), using the "min. SIC" rule proposed by Liu et al. (1997)

You can see that we have evidence of structural breaks in 1958, 1990, and 2001. The second of these dates lines up nicely with my "eye-ball" conclusion from the previous graph.
Now let's focus on the data for the period 1935 to 1990. I'm going to test to see if there is evidence of unit roots in the logarithms of POP and SHEEP. As there is, I'm then going test if the logarithm of NZSR is stationary. In other words, I'll be checking we have cointegration in the logarithms of the data.
At each step, I'll allow for the fact that there is evidence of a structural break in 1958. The incorporation of breakpoint unit root tests is one of the many nice new features in the Beta release of EViews 9, as noted in my previous post, here.
Here is how I've done this for the log(POP) series:
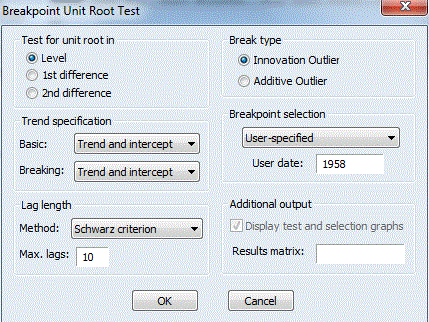
Now let's focus on the data for the period 1935 to 1990. I'm going to test to see if there is evidence of unit roots in the logarithms of POP and SHEEP. As there is, I'm then going test if the logarithm of NZSR is stationary. In other words, I'll be checking we have cointegration in the logarithms of the data.
At each step, I'll allow for the fact that there is evidence of a structural break in 1958. The incorporation of breakpoint unit root tests is one of the many nice new features in the Beta release of EViews 9, as noted in my previous post, here.
This implements Perron's (1989) modified ADF tests, and here's the result:

Clearly, we can't reject the null of a unit root. In the case of the log(SHEEP) series, the corresponding ADF statistic is -0.9597 (p ≥ 0.50), so we come to the same conclusion.
The log(NZSR) series is trendless over this period, so this is taken into account when applying the modified ADF test:

The modified ADF statistic -3.5716 (p < 0.10). The p-values for the modified ADF tests are based on the asymptotic distributions for the test statistics, and we have T = 56. None the less, we have reasonable evidence that log(POP) and log(SHEEP) were cointegrated over the period 1935 to 1990. Their log-ratio was stationary.
There's our "Great Ratio"!
Clearly, we can't reject the null of a unit root. In the case of the log(SHEEP) series, the corresponding ADF statistic is -0.9597 (p ≥ 0.50), so we come to the same conclusion.
The log(NZSR) series is trendless over this period, so this is taken into account when applying the modified ADF test:
The modified ADF statistic -3.5716 (p < 0.10). The p-values for the modified ADF tests are based on the asymptotic distributions for the test statistics, and we have T = 56. None the less, we have reasonable evidence that log(POP) and log(SHEEP) were cointegrated over the period 1935 to 1990. Their log-ratio was stationary.
There's our "Great Ratio"!
(For the record, exactly the same conclusions are reached if we use the levels, rather than the logarithms, of the data.)
The second graph given earlier makes it pretty clear that the (Great) New Zealand Sheep Ratio is no longer with us. By way of confirmation, I've tested for a unit root in log(NZSR) over the full sample, 1935 to 2011. I used each of the of the breakpoint unit root tests available in EViews 9 that allow for innovation outlier breaks. There are 16 tests in total when you allow for the varous drfit/trend options.
By way of an example, here are the results for Dickey-Fuller max.-t test, allowing for an innovation trend-break:
For all of the tests applied to the full series for log(NZSR), or for NZSR itself, very large p-values are achieved and so we cannot reject a unit root in the data.
The New Zealand Sheep Ratio appears to be a thing of the past!
References
Attfield, C. and J. R. W. Temple, 2010. Balanced growth and the great ratios: New evidence for the US and the UK. Journal of Macroeconomics, 32, 937-956. (Free Working Paper version here.)
Bai, J. and P. Perron, 1998. Estimating and testing linear models with multiple structural changes. Econometrica, 66, 47–78.
Harvey, D. I., S. J. Leybourne, and P. Newbold, 2003. How great are the great ratios? Applied Economics, 35, 163-177.
Bai, J. and P. Perron, 1998. Estimating and testing linear models with multiple structural changes. Econometrica, 66, 47–78.
Klein, L. R. and R. F. Kosubud, 1961. Some econometrics of growth: Great ratios of economics. Quarterly Journal of Economics, 75, 173-198.
Perron, P., 1989. The great crash, the oil price shock, and the unit root hypothesis. Econometrica, 57, 1361-1401.
Liu, J., S. Wu, and J. V. Zidek, 1997. On segmented multivariate regression. Statistica Sinica, 7, 497–525.
Perron, P., 1989. The great crash, the oil price shock, and the unit root hypothesis. Econometrica, 57, 1361-1401.
Ryan, K. F. and D. E. A. Giles, 1998. Testing for unit roots in economic time-series with missing observations. In T. B. Fomby and R. C. Hill (eds.), Advances in Econometrics. JAI Press, Greenwich, CT, 203-242. (The final Working Paper version of the paper is available here, and the Figures are here.)
Simon, J. L., 1990. Great and almost-great magnitudes in economics. Journal of Economic Perspectives, 4, 149-156.

Please comment on the article here: Econometrics Beat: Dave Giles' Blog
