Posts Tagged ‘ summary() ’

R summary() got better!

June 4, 2017
By

Here is a really nice feature found in the current 3.4.0 version of R: summary() has become a lot more reasonable. summary(15555) # Min. 1st Qu. Median Mean 3rd Qu. Max. # 15555 15555 15555 15555 15555 15555 Please read on for some background. In older versions of R (say R 3.3.1) the above code … Continue reading R summary() got better!

Read more »

Exploratory Data Analysis: Quantile-Quantile Plots for New York’s Ozone Pollution Data

Exploratory Data Analysis: Quantile-Quantile Plots for New York’s Ozone Pollution Data

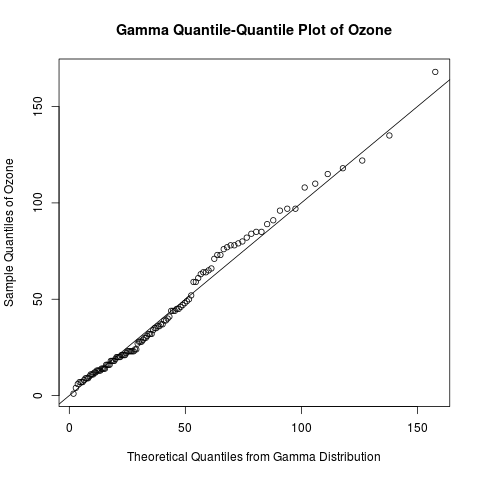
Introduction Continuing my recent series on exploratory data analysis, today’s post focuses on quantile-quantile (Q-Q) plots, which are very useful plots for assessing how closely a data set fits a particular distribution.  I will discuss how Q-Q plots are constructed and use Q-Q plots to assess the distribution of the “Ozone” data from the built-in […]

Read more »

Summary stats for ABC

September 1, 2013
By
Summary stats for ABC

Introduction In the previous post I gave a very brief introduction to ABC, including a simple example for inferring the parameters of a Markov process given some time series observations. Towards the end of the post I observed that there were (at least!) two potential problems with scaling up the simple approach described, one relating […]

Read more »

Summary stats for ABC

September 1, 2013
By
Summary stats for ABC

Introduction In the previous post I gave a very brief introduction to ABC, including a simple example for inferring the parameters of a Markov process given some time series observations. Towards the end of the post I observed that there were (at least!) two potential problems with scaling up the simple approach described, one relating […]

Read more »

Exploratory Data Analysis: Useful R Functions for Exploring a Data Frame

Exploratory Data Analysis: Useful R Functions for Exploring a Data Frame

Introduction Data in R are often stored in data frames, because they can store multiple types of data.  (In R, data frames are more general than matrices, because matrices can only store one type of data.)  Today’s post highlights some common functions in R that I like to use to explore a data frame before […]

Read more »

Exploratory Data Analysis: The 5-Number Summary – Two Different Methods in R

Exploratory Data Analysis: The 5-Number Summary – Two Different Methods in R

Introduction Continuing my recent series on exploratory data analysis (EDA), today’s post focuses on 5-number summaries, which were previously mentioned in the post on descriptive statistics in this series.  I will define and calculate the 5-number summary in 2 different ways that are commonly used in R.  (It turns out that different methods arise from […]

Read more »

Exploratory Data Analysis – Kernel Density Estimation and Rug Plots in R on Ozone Data in New York and Ozonopolis

Exploratory Data Analysis – Kernel Density Estimation and Rug Plots in R on Ozone Data in New York and Ozonopolis

Update on July 15, 2013: Thanks to Harlan Nelson for noting on AnalyticBridge that the ozone concentrations for both New York and Ozonopolis are non-negative quantities, so their kernel density plot should have non-negative support sets.  This has been corrected in this post by - defining new variables called max.ozone and max.ozone2 - using the […]

Read more »

Exploratory Data Analysis: Kernel Density Estimation – Conceptual Foundations

Exploratory Data Analysis: Kernel Density Estimation – Conceptual Foundations

For the sake of brevity, this post has been created from the first half of a previous long post on kernel density estimation.  This first half focuses on the conceptual foundations of kernel density estimation.  The second half will focus on constructing kernel density plots and rug plots in R. Introduction Recently, I began a […]

Read more »

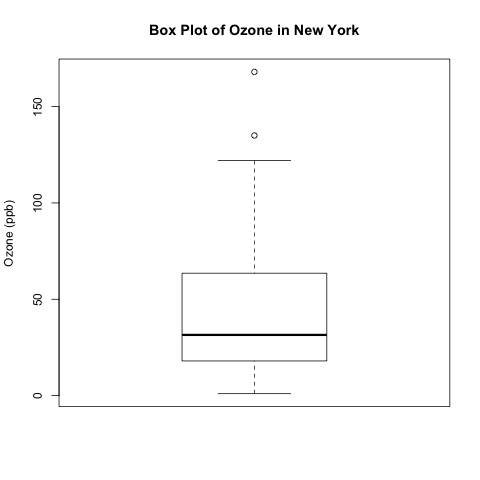
Exploratory Data Analysis: Variations of Box Plots in R for Ozone Concentrations in New York City and Ozonopolis

Exploratory Data Analysis: Variations of Box Plots in R for Ozone Concentrations in New York City and Ozonopolis

Introduction Last week, I wrote the first post in a series on exploratory data analysis (EDA).  I began by calculating summary statistics on a univariate data set of ozone concentration in New York City in the built-in data set “airquality” in R.  In particular, I talked about how to calculate those statistics when the data […]

Read more »

Exploratory Data Analysis – Computing Descriptive Statistics in R for Data on Ozone Pollution in New York City

Exploratory Data Analysis – Computing Descriptive Statistics in R for Data on Ozone Pollution in New York City

Introduction This is the first of a series of posts on exploratory data analysis (EDA).  This post will calculate the common summary statistics of a univariate continuous data set – the data on ozone pollution in New York City that is part of the built-in “airquality” data set in R.  This is a particularly good data set […]

Read more »


Subscribe

Email:

  Subscribe