Posts Tagged ‘ normal ’

Profile Likelihood for New Jersey U.S. Senate Special Election

September 16, 2013
By
Profile Likelihood for New Jersey U.S. Senate Special Election

As it stands right now Cory Booker has a very good chance of winning the New Jersey Special U.S. Senate election on October 16 to replace Frank Lautenberg and fill the remainder of his term for the next 15 months.  So with the election only about a month away I took advantage of some of […]
Read more »

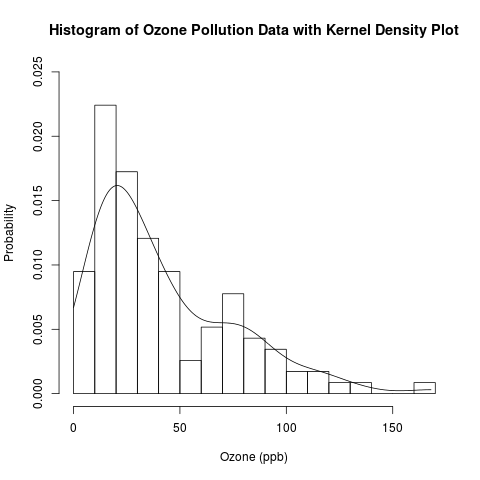
Exploratory Data Analysis: Combining Histograms and Density Plots to Examine the Distribution of the Ozone Pollution Data from New York in R

Exploratory Data Analysis: Combining Histograms and Density Plots to Examine the Distribution of the Ozone Pollution Data from New York in R

Introduction This is a follow-up post to my recent introduction of histograms.  Previously, I presented the conceptual foundations of histograms and used a histogram to approximate the distribution of the “Ozone” data from the built-in data set “airquality” in R.  Today, I will examine this distribution in more detail by overlaying the histogram with parametric […]

Read more »

Finding the Distribution Parameters

April 10, 2013
By
Finding the Distribution Parameters

This is a brief description on one way to determine the distribution of given data. There are several ways to accomplish this in R especially if one is trying to determine if the data comes from a normal distribution. Rather than focusing on hypothesis testing and determining if a distribution is actually the said distribution [...]

Read more »

Checking for Normality with Quantile Ranges and the Standard Deviation

Checking for Normality with Quantile Ranges and the Standard Deviation

Introduction I was reading Michael Trosset’s “An Introduction to Statistical Inference and Its Applications with R”, and I learned a basic but interesting fact about the normal distribution’s interquartile range and standard deviation that I had not learned before.  This turns out to be a good way to check for normality in a data set. […]

Read more »

Confusing Stats Terms Explained: Residual

October 25, 2010
By

When I hear the word "residual", the pulp left over after I drink my orange juice pops into my brain, or perhaps the film left on the car after a heavy rain. However, when my regression model spits out an estimate of my model's residual, I'm fairly confident it isn't referring to OJ or automobile gunk...right? Not so fast, that imagery is more similar to it's statistical meaning than you…

Read more »

Confusing Stats Terms Explained: Multicollinearity

August 18, 2010
By
Confusing Stats Terms Explained: Multicollinearity

Multicollinearity said in "plain English" is redundancy. Unfortunately, it isn't quite that simple, but it's a good place to start. Put simply, multicollinearity is when two or more predictors in a regression are highly related to one another, such that they do not provide unique and/or independent information to the regression.A common example that is used to demonstrate this idea is having both height and weight as predictors in a…

Read more »

Confusing Stats Terms Explained: Standard Deviation

August 1, 2010
By
Confusing Stats Terms Explained: Standard Deviation

Most people find statistics to be complicated, confusing, and just generally frustrating. One of the biggest causes of confusion is the complicated vocabulary that is associated with stats. Frankly, it sometimes seems that stats terms were made to be intentionally complicated. In fact, some concepts seem perfectly understandable when described inplain English, but seem incomprehensible when described in stats lingo.With this in mind, I decided to compile a list of…

Read more »


Subscribe

Email:

  Subscribe