Posts Tagged ‘ factor() ’

Visualizing effects of a categorical explanatory variable in a regression

January 20, 2018
By
Visualizing effects of a categorical explanatory variable in a regression

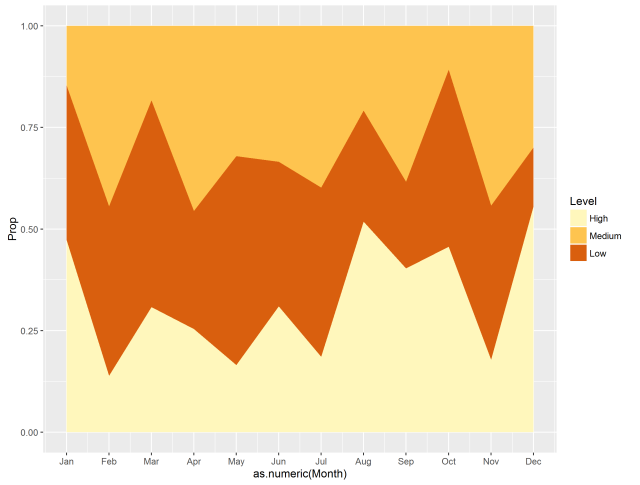
Recently, I’ve been working on two problems that might be related to semiotic issues in predictive modeling (i.e. instead of a standard regression table, how can we plot coefficient values in a regression model). To be more specific, I have a variable of interest that is observed for several individuals , with explanatory variables , year , in a specific region . Suppose that we have a simple (standard) linear model…
Read more »

How do I re-arrange??: Ordering a plot re-revisited

March 3, 2016
By
How do I re-arrange??: Ordering a plot re-revisited

Several years back I wrote a two part blog series in response to seeing questions about plotting and reordering on list serves, talkstats.com, and stackoverflow.  Part I discussed the basics of reordering plots by reordering factor levels.  The essential gist was: … Continue reading →

Read more »

Principal Component Analysis in 6 steps

March 21, 2015
By
Principal Component Analysis in 6 steps

A common-sense explanation of PCA, and how to do it yourself in six steps.

Read more »

How to Get the Frequency Table of a Categorical Variable as a Data Frame in R

Introduction One feature that I like about R is the ability to access and manipulate the outputs of many functions.  For example, you can extract the kernel density estimates from density() and scale them to ensure that the resulting density integrates to 1 over its support set. I recently needed to get a frequency table of […]

Read more »

How to Get the Frequency Table of a Categorical Variable as a Data Frame in R

How to Get the Frequency Table of a Categorical Variable as a Data Frame in R

Introduction One feature that I like about R is the ability to access and manipulate the outputs of many functions.  For example, you can extract the kernel density estimates from density() and scale them to ensure that the resulting density integrates to 1 over its support set. I recently needed to get a frequency table of […]

Read more »

Mathematical and Applied Statistics Lesson of the Day – Don’t Use the Terms “Independent Variable” and “Dependent Variable” in Regression

Mathematical and Applied Statistics Lesson of the Day – Don’t Use the Terms “Independent Variable” and “Dependent Variable” in Regression

In math and science, we learn the equation of a line as , with being called the dependent variable and being called the independent variable.  This terminology holds true for more complicated functions with multiple variables, such as in polynomial regression. I highly discourage the use of “independent” and “dependent” in the context of statistics […]

Read more »

Applied Statistics Lesson of the Day – Notation for Fractional Factorial Designs

Applied Statistics Lesson of the Day – Notation for Fractional Factorial Designs

Fractional factorial designs use the notation; unfortunately, this notation is not clearly explained in most textbooks or web sites about experimental design.  I hope that my explanation below is useful. is the number of levels in each factor; note that the notation assumes that all factors have the same number of levels. If a factor has […]

Read more »

Applied Statistics Lesson of the Day – Fractional Factorial Design and the Sparsity-of-Effects Principle

Applied Statistics Lesson of the Day – Fractional Factorial Design and the Sparsity-of-Effects Principle

Consider again an experiment that seeks to determine the causal relationships between  factors and the response, where .  Ideally, the sample size is large enough for a full factorial design to be used.  However, if the sample size is small and the number of possible treatments is large, then a fractional factorial design can be used instead.  Such a […]

Read more »

Applied Statistics Lesson of the Day – Additive Models vs. Interaction Models in 2-Factor Experimental Designs

Applied Statistics Lesson of the Day – Additive Models vs. Interaction Models in 2-Factor Experimental Designs

In a recent “Machine Learning Lesson of the Day“, I discussed the difference between a supervised learning model in machine learning and a regression model in statistics.  In that lesson, I mentioned that a statistical regression model usually consists of a systematic component and a random component.  Today’s lesson strictly concerns the systematic component. An […]

Read more »

Applied Statistics Lesson of the Day – The Full Factorial Design

Applied Statistics Lesson of the Day – The Full Factorial Design

An experimenter may seek to determine the causal relationships between factors and the response, where .  On first instinct, you may be tempted to conduct separate experiments, each using the completely randomized design with 1 factor.  Often, however, it is possible to conduct 1 experiment with  factors at the same time.  This is better than […]

Read more »


Subscribe

Email:

  Subscribe