Posts Tagged ‘ box plot ’

"To Pie or Not To Pie" That is the question! Graph theory

March 2, 2016
By
"To Pie or Not To Pie" That is the question! Graph theory

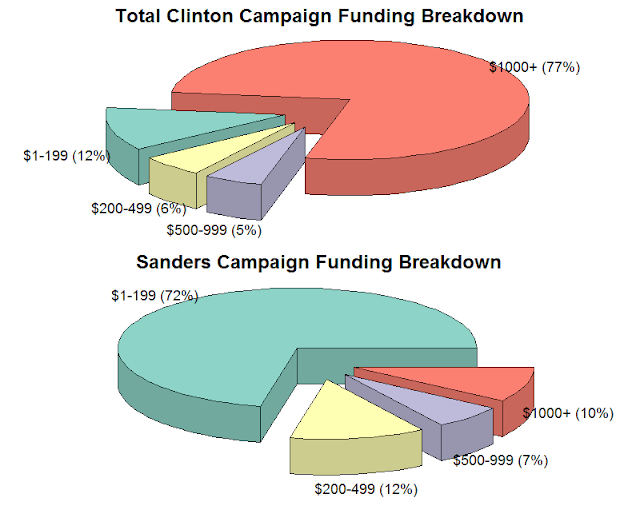
In several recent posts I have attempted to convey the nature of how the current primary season is funded (on the Democratic side). In order to assist in conveying this information I have employed several different analytical angles and graphical strat...

Read more »

Exploratory Data Analysis – All Blog Posts on The Chemical Statistician

Exploratory Data Analysis – All Blog Posts on The Chemical Statistician

This series of posts introduced various methods of exploratory data analysis, providing theoretical backgrounds and practical examples.  Fully commented and readily usable R scripts are available for all topics for you to copy and paste for your own analysis!  Most of these posts involve data visualization and plotting, and I include a lot of detail and […]

Read more »

Exploratory Data Analysis – All Blog Posts on The Chemical Statistician

Exploratory Data Analysis – All Blog Posts on The Chemical Statistician

This series of posts introduced various methods of exploratory data analysis, providing theoretical backgrounds and practical examples.  Fully commented and readily usable R scripts are available for all topics for you to copy and paste for your own analysis!  Most of these posts involve data visualization and plotting, and I include a lot of detail and […]

Read more »

Box plot, Fisher’s style

June 5, 2014
By
Box plot, Fisher’s style

In a recent issue of Significance, I discovered an interesting – and amuzing – figure, about some box & beard plot, in Dr Fisher’s casebook: Beard the statistician in his den. In French, the box plot (introduced by John Tukey, not George Box, as discussed in a previous post) is popular under the name boîte à moustaches (box with a mustache, for a simple translation). > set.seed(2) > x=rnorm(500) > boxplot(x,horizontal=TRUE,axes=FALSE)…

Read more »

Exploratory Data Analysis: Combining Box Plots and Kernel Density Plots into Violin Plots for Ozone Pollution Data

Exploratory Data Analysis: Combining Box Plots and Kernel Density Plots into Violin Plots for Ozone Pollution Data

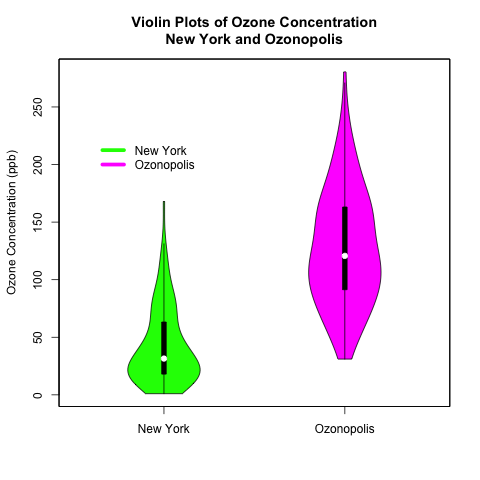
Introduction Recently, I began a series on exploratory data analysis (EDA), and I have written about descriptive statistics, box plots, and kernel density plots so far.  As previously mentioned in my post on box plots, there is a way to combine box plots and kernel density plots.  This combination results in violin plots, and I […]

Read more »

Exploratory Data Analysis: Variations of Box Plots in R for Ozone Concentrations in New York City and Ozonopolis

Exploratory Data Analysis: Variations of Box Plots in R for Ozone Concentrations in New York City and Ozonopolis

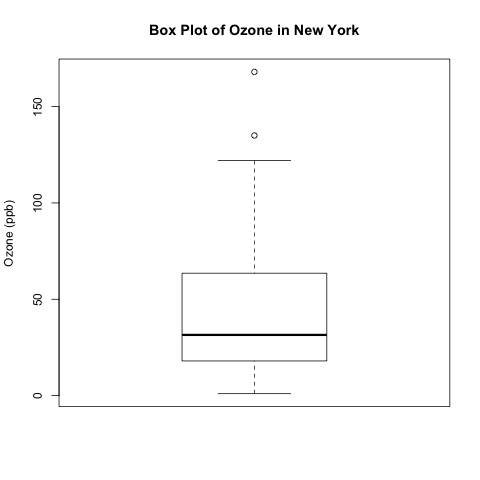
Introduction Last week, I wrote the first post in a series on exploratory data analysis (EDA).  I began by calculating summary statistics on a univariate data set of ozone concentration in New York City in the built-in data set “airquality” in R.  In particular, I talked about how to calculate those statistics when the data […]

Read more »

Discovering Argon with the 2-Sample t-Test

March 11, 2013
By
Discovering Argon with the 2-Sample t-Test

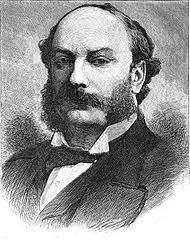
I learned about Lord Rayleigh’s discovery of argon in my 2nd-year analytical chemistry class while reading “Quantitative Chemical Analysis” by Daniel Harris.  (William Ramsay was also responsible for this discovery.)  This is one of my favourite stories in chemistry; it illustrates how diligence in measurement can lead to an elegant and surprising discovery.  I find […]

Read more »


Subscribe

Email:

  Subscribe