
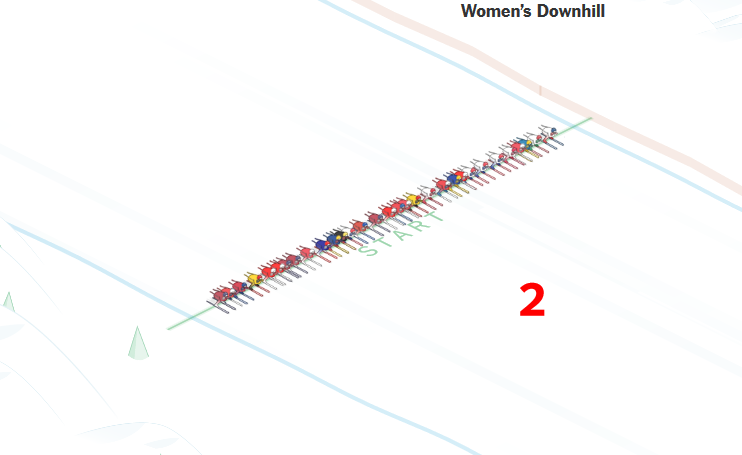
Once again: the New York Times presents an innovative graphic, which you always want to watch again and again. It’s this Downhill Race at the Olympics: . Start Run Finish The link to the moving graphic is below this picture: For Statistics? It would be exciting to follow such visualizations, e. g. on changes […]


