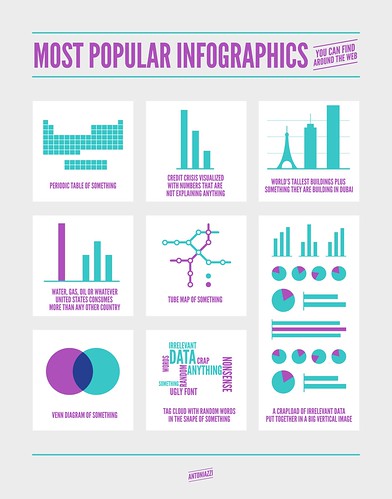
I saw this great infographic at Andrew Gelman’s blog. I’m inclined to buy an art print. Note the relationship between the central panel and the cover of the latest Amstat News (always a good source for embarrassing figures):

I saw this great infographic at Andrew Gelman’s blog. I’m inclined to buy an art print. Note the relationship between the central panel and the cover of the latest Amstat News (always a good source for embarrassing figures):

One of the coolest R packages I heard about at the useR! Conference: Toby Dylan Hocking‘s directlabels package for putting labels directly next to the relevant curves or point clouds in a figure. I think I first learned about this idea from Andrew Gelman: that a separate legend requires a lot of back-and-forth glances, so [...]

I was at the useR! Conference at The University of Warwick in Coventry, UK, last week. My goal in going was to learn the latest things regarding (simple) dynamic graphics, (simple) web-based apps, parallel computing, and memory management (dealing with big data sets). I got just what I was hoping for and more. There are [...]

Let’s start this blog off right, with the stupidest R mistake I’ve ever made (I think). In the R package that I write, R/qtl, one of the main file formats is a comma-delimited file, where the blank cells in the second row are important, as they distinguish the initial phenotype columns from the genetic marker [...]
